TeamQuest View provides key analysis functionality. TeamQuest View functionality includes:
- Correlation Analysis
- Short Term Analysis
- Linear Trend Analysis
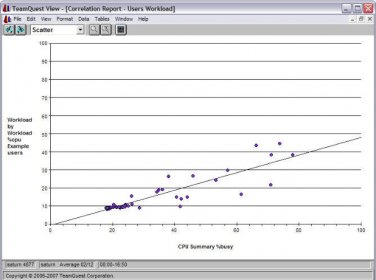
Correlation analysis aids in identifying the root cause of a performance problem, allowing you to explore cause-effect relationships within performance data.
Short term analysis identifies potential problems early by generating exception events (alarms) based on historical averages (rather than a fixed threshold) tied to a particular time interval. For example, if a particular resource averages 60% busy on Tuesdays and 50% busy on Thursdays, an exception event will only be generated when utilization crosses those thresholds on the respective days. TeamQuest View can chart the results of short term analysis.
Linear trend analysis looks at historical data and projects a linear trend into the future, calculating upper and lower confidence intervals as well as a threshold at which resources will become inadequate. An alarm can be generated when the threshold is exceeded, and TeamQuest View can then be used to display the actual data along with the calculated trend line and confidence intervals.
Comments